Dashboard
Beta product
This product is currently in beta. It may not be available to all Kevel customers, and features described may change before the product is generally available.
This is publisher-facing documentation
Because every Kevel Self-serve instance is uniquely customized to the publisher's branding and use case, exact Self-serve functionality will vary from publisher to publisher.
For this reason, Kevel does not provide advertiser-facing documentation for your advertisers to use. However, these pages can be used as a starting point for providing your own educational materials for your advertisers.
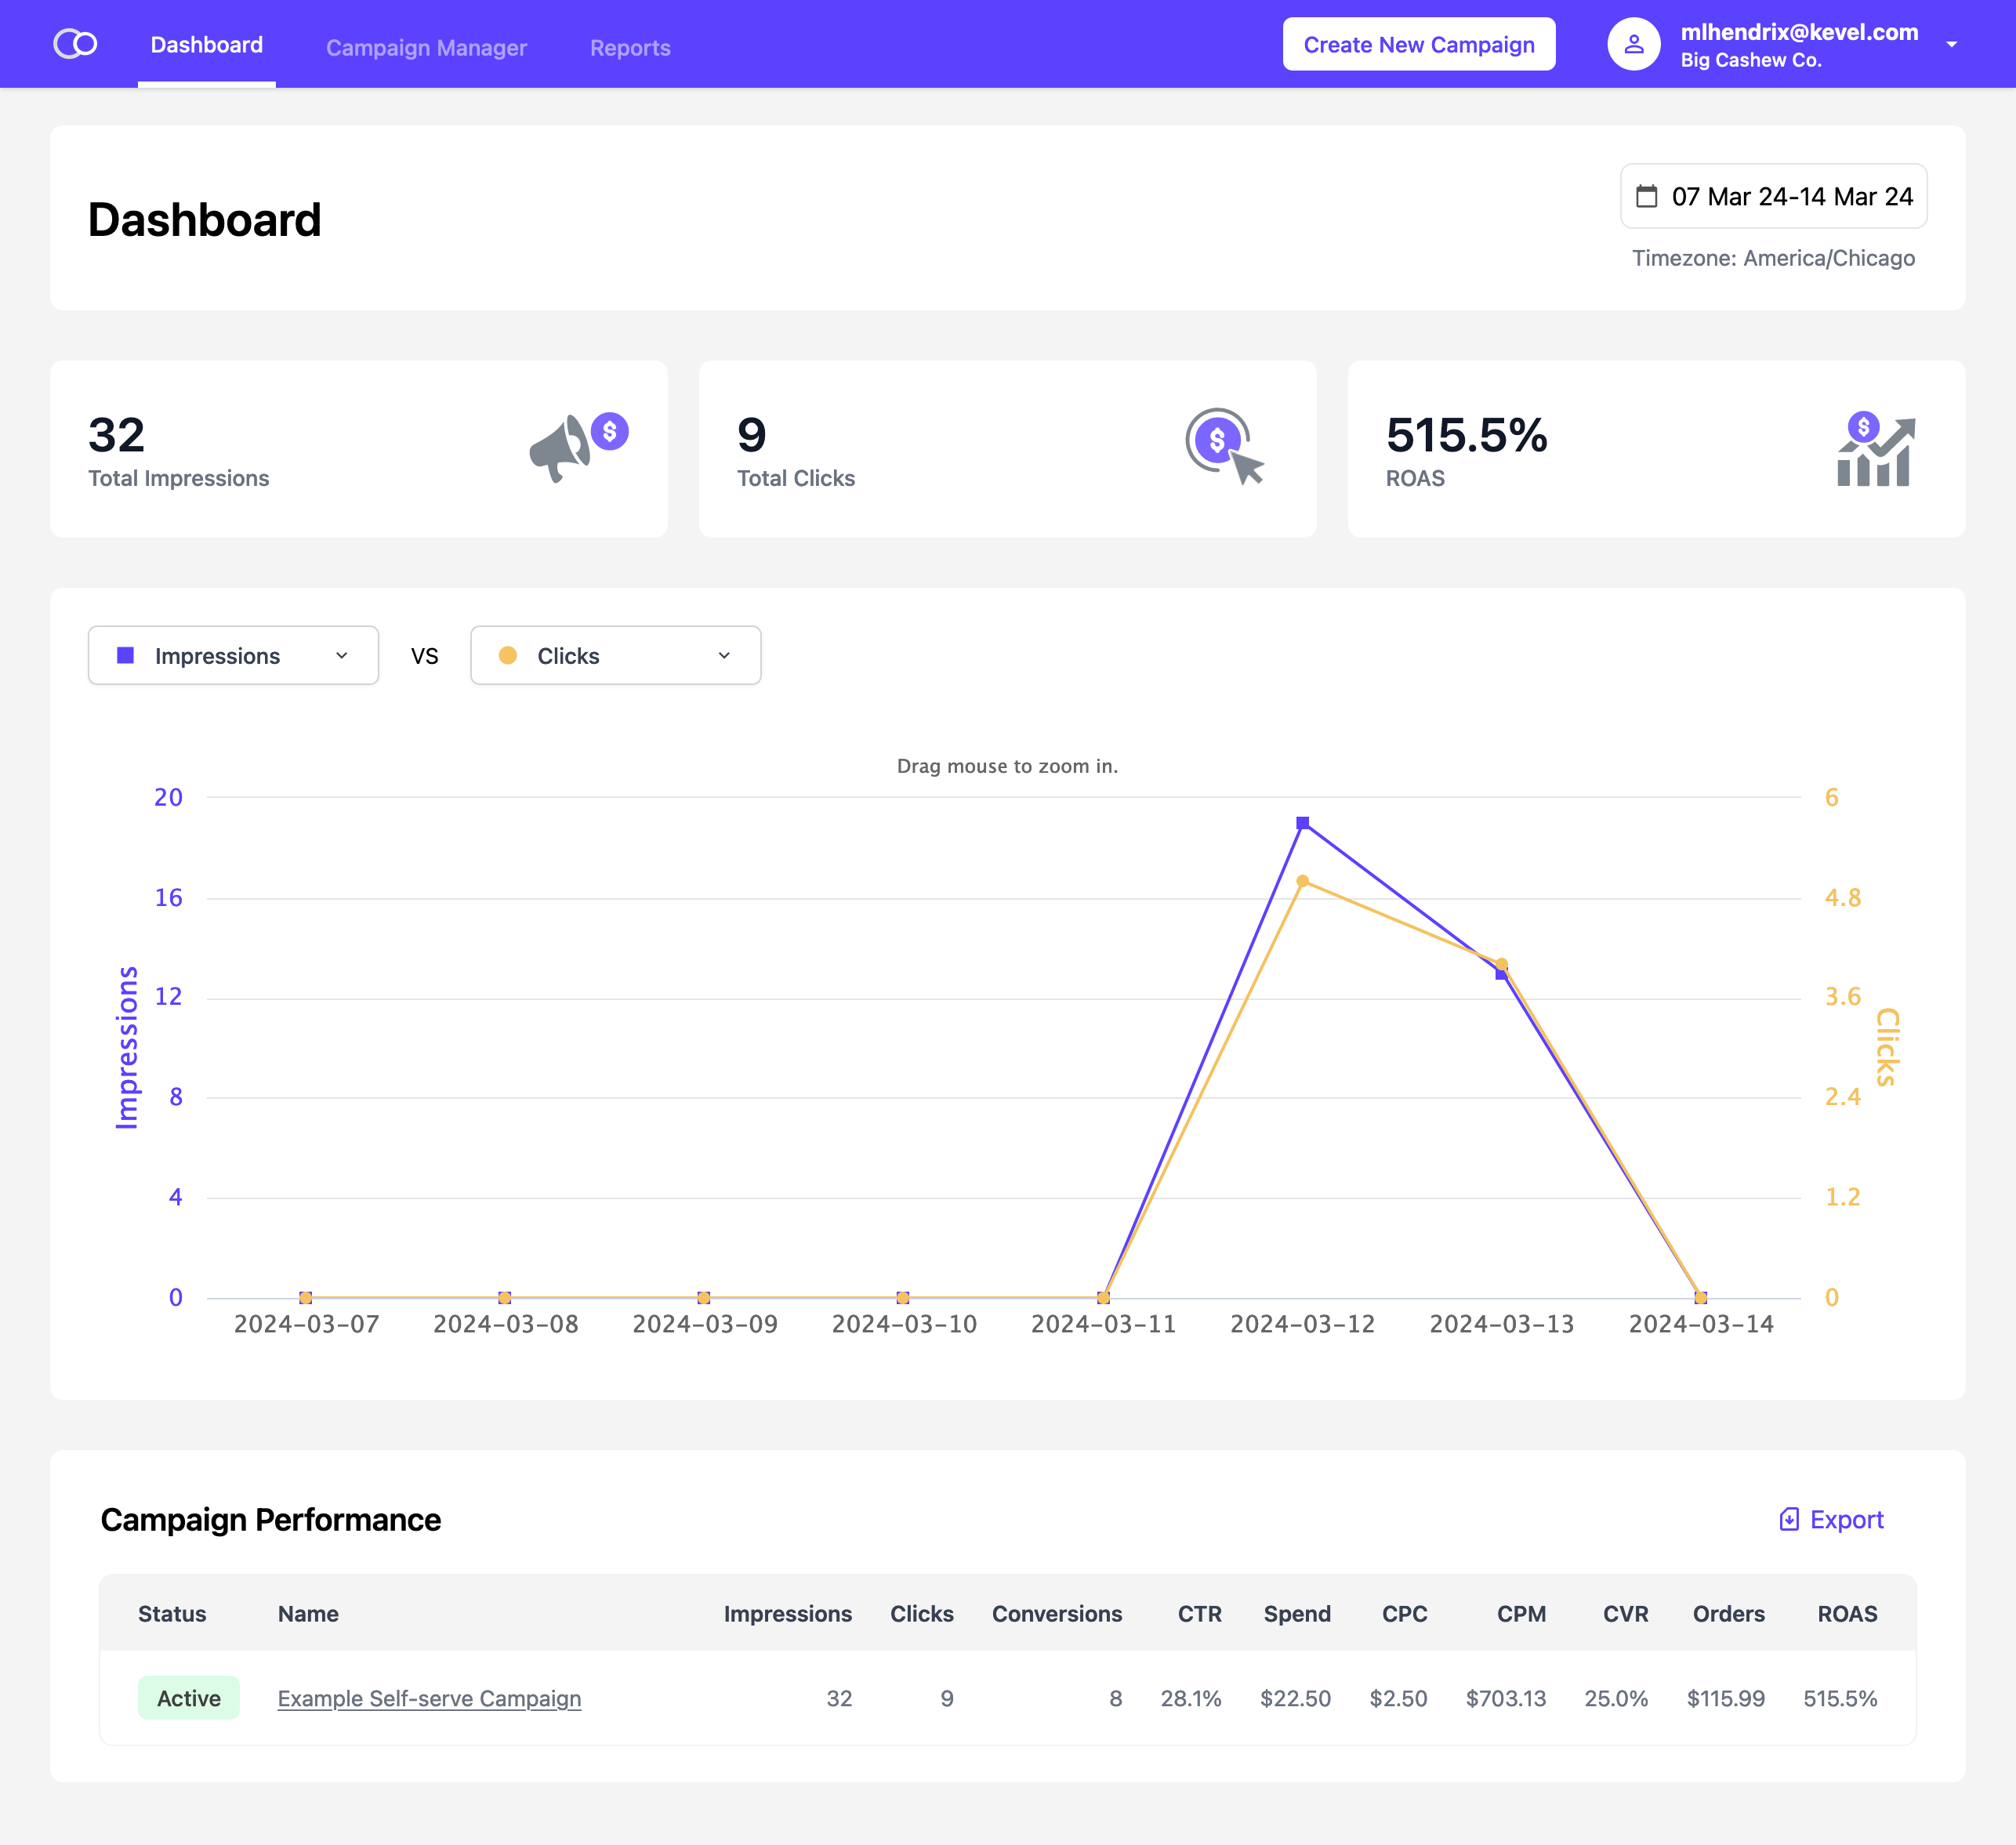
The dashboard contains a high-level view of your ad program. It helps you get a quick snapshot of meaningful metrics, including overall performance of your promoted products, a snapshot of active campaigns, and performance of your products by main category.
Data on this page may have a lag of up to 3-4 hours.
Date range
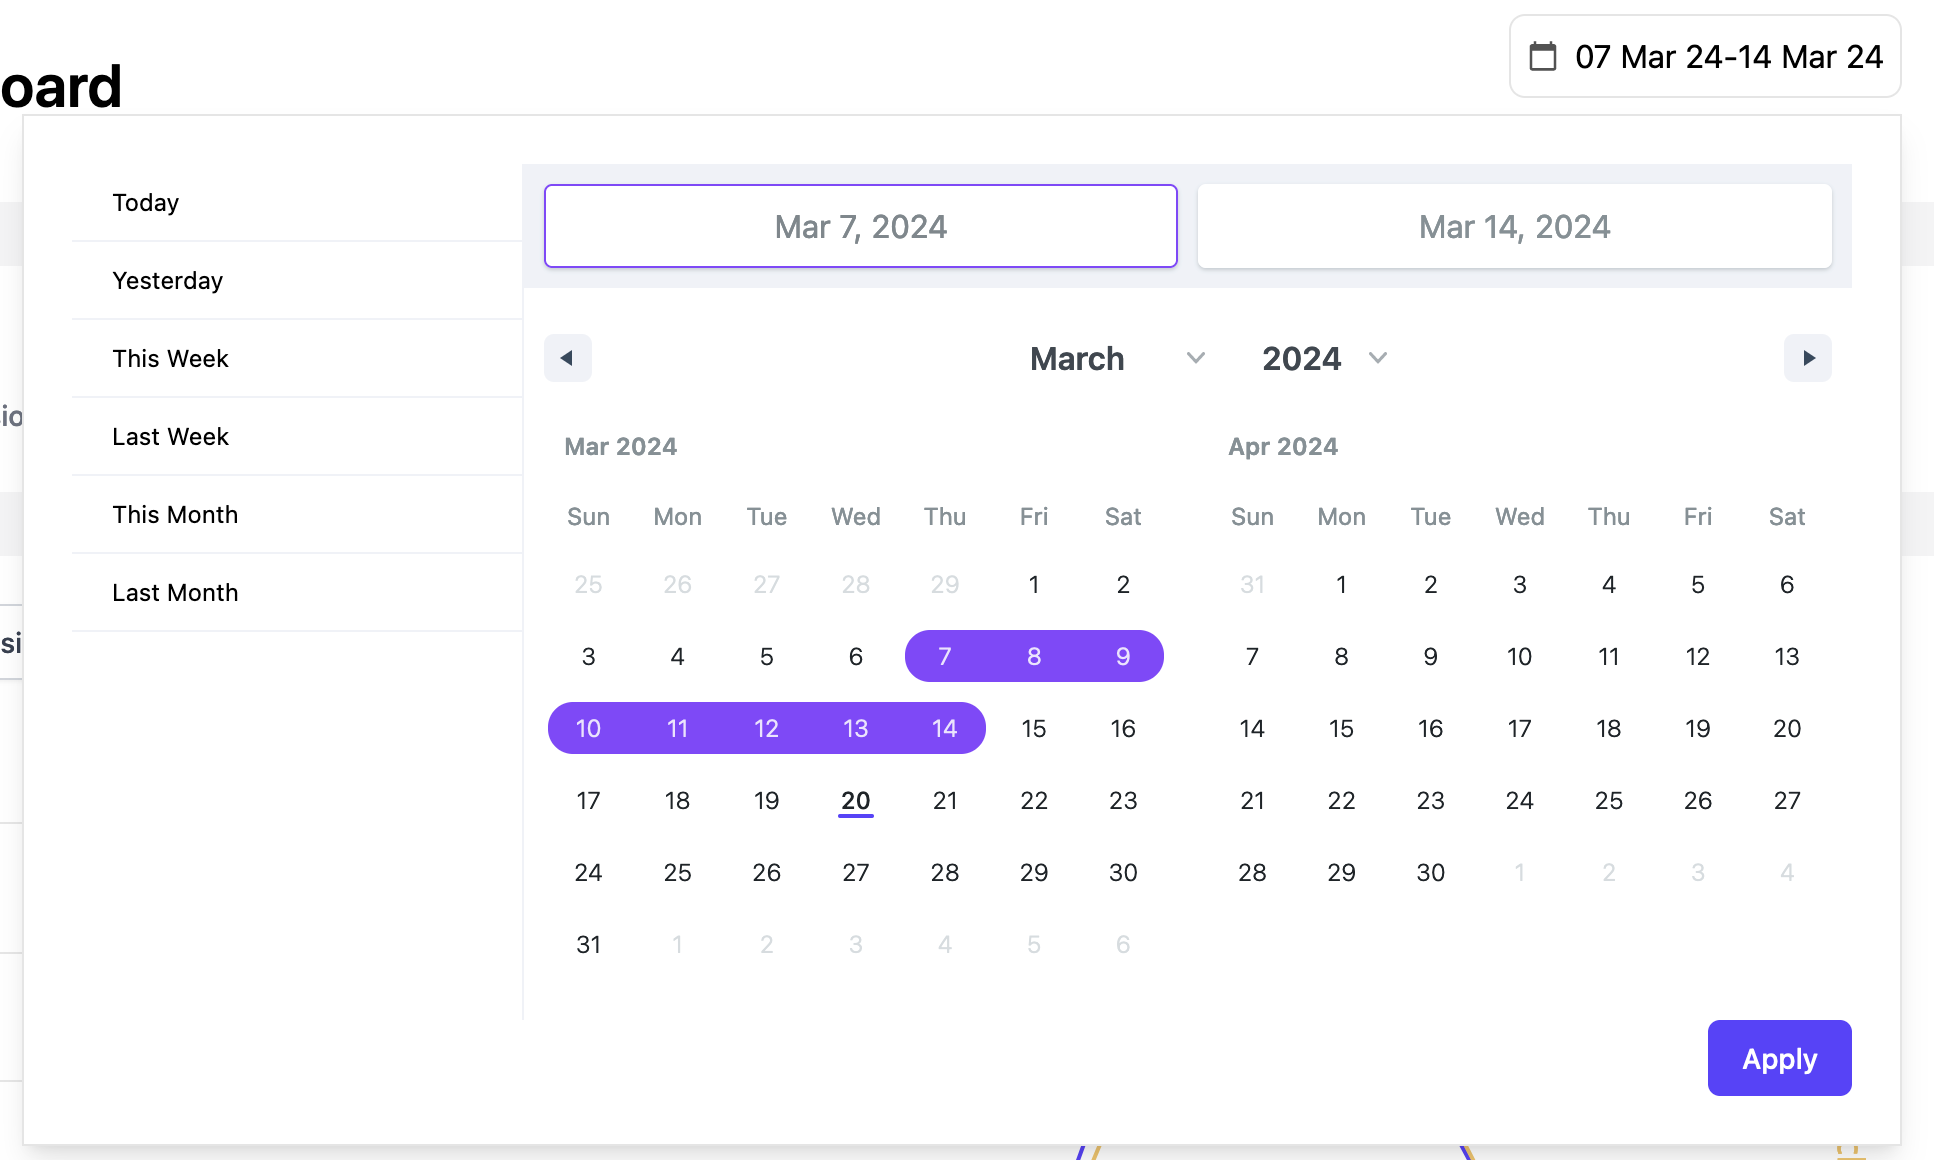
Use the date range picker at the top of the page to select a date range. The date range picker affects the date range for all data on the dashboard. By default, the past week is selected.
Callout metrics
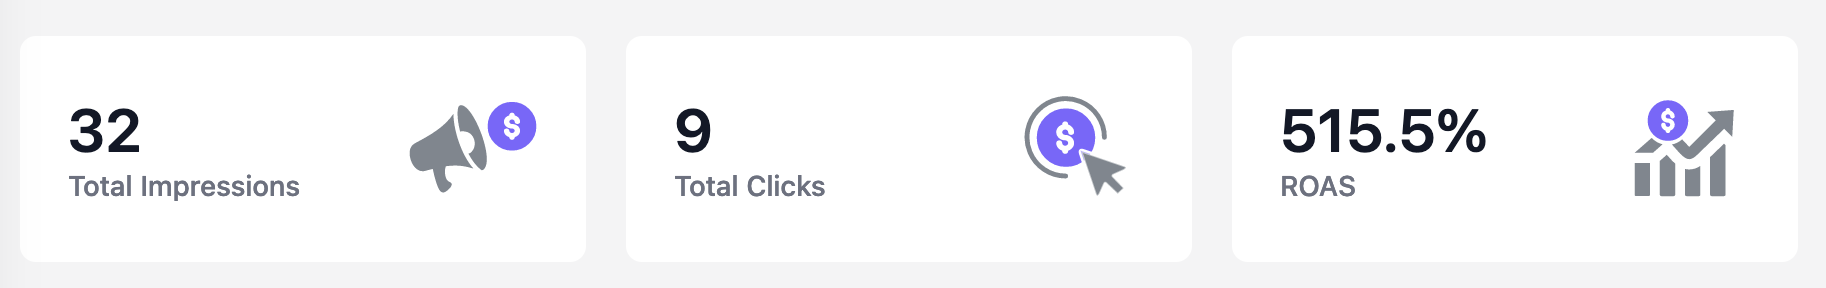
These three metrics show a high-level summary of total ad impressions, clicks, and ROAS (return on ad spend) or CTR (click-through rate) for the time period selected.
Line graph
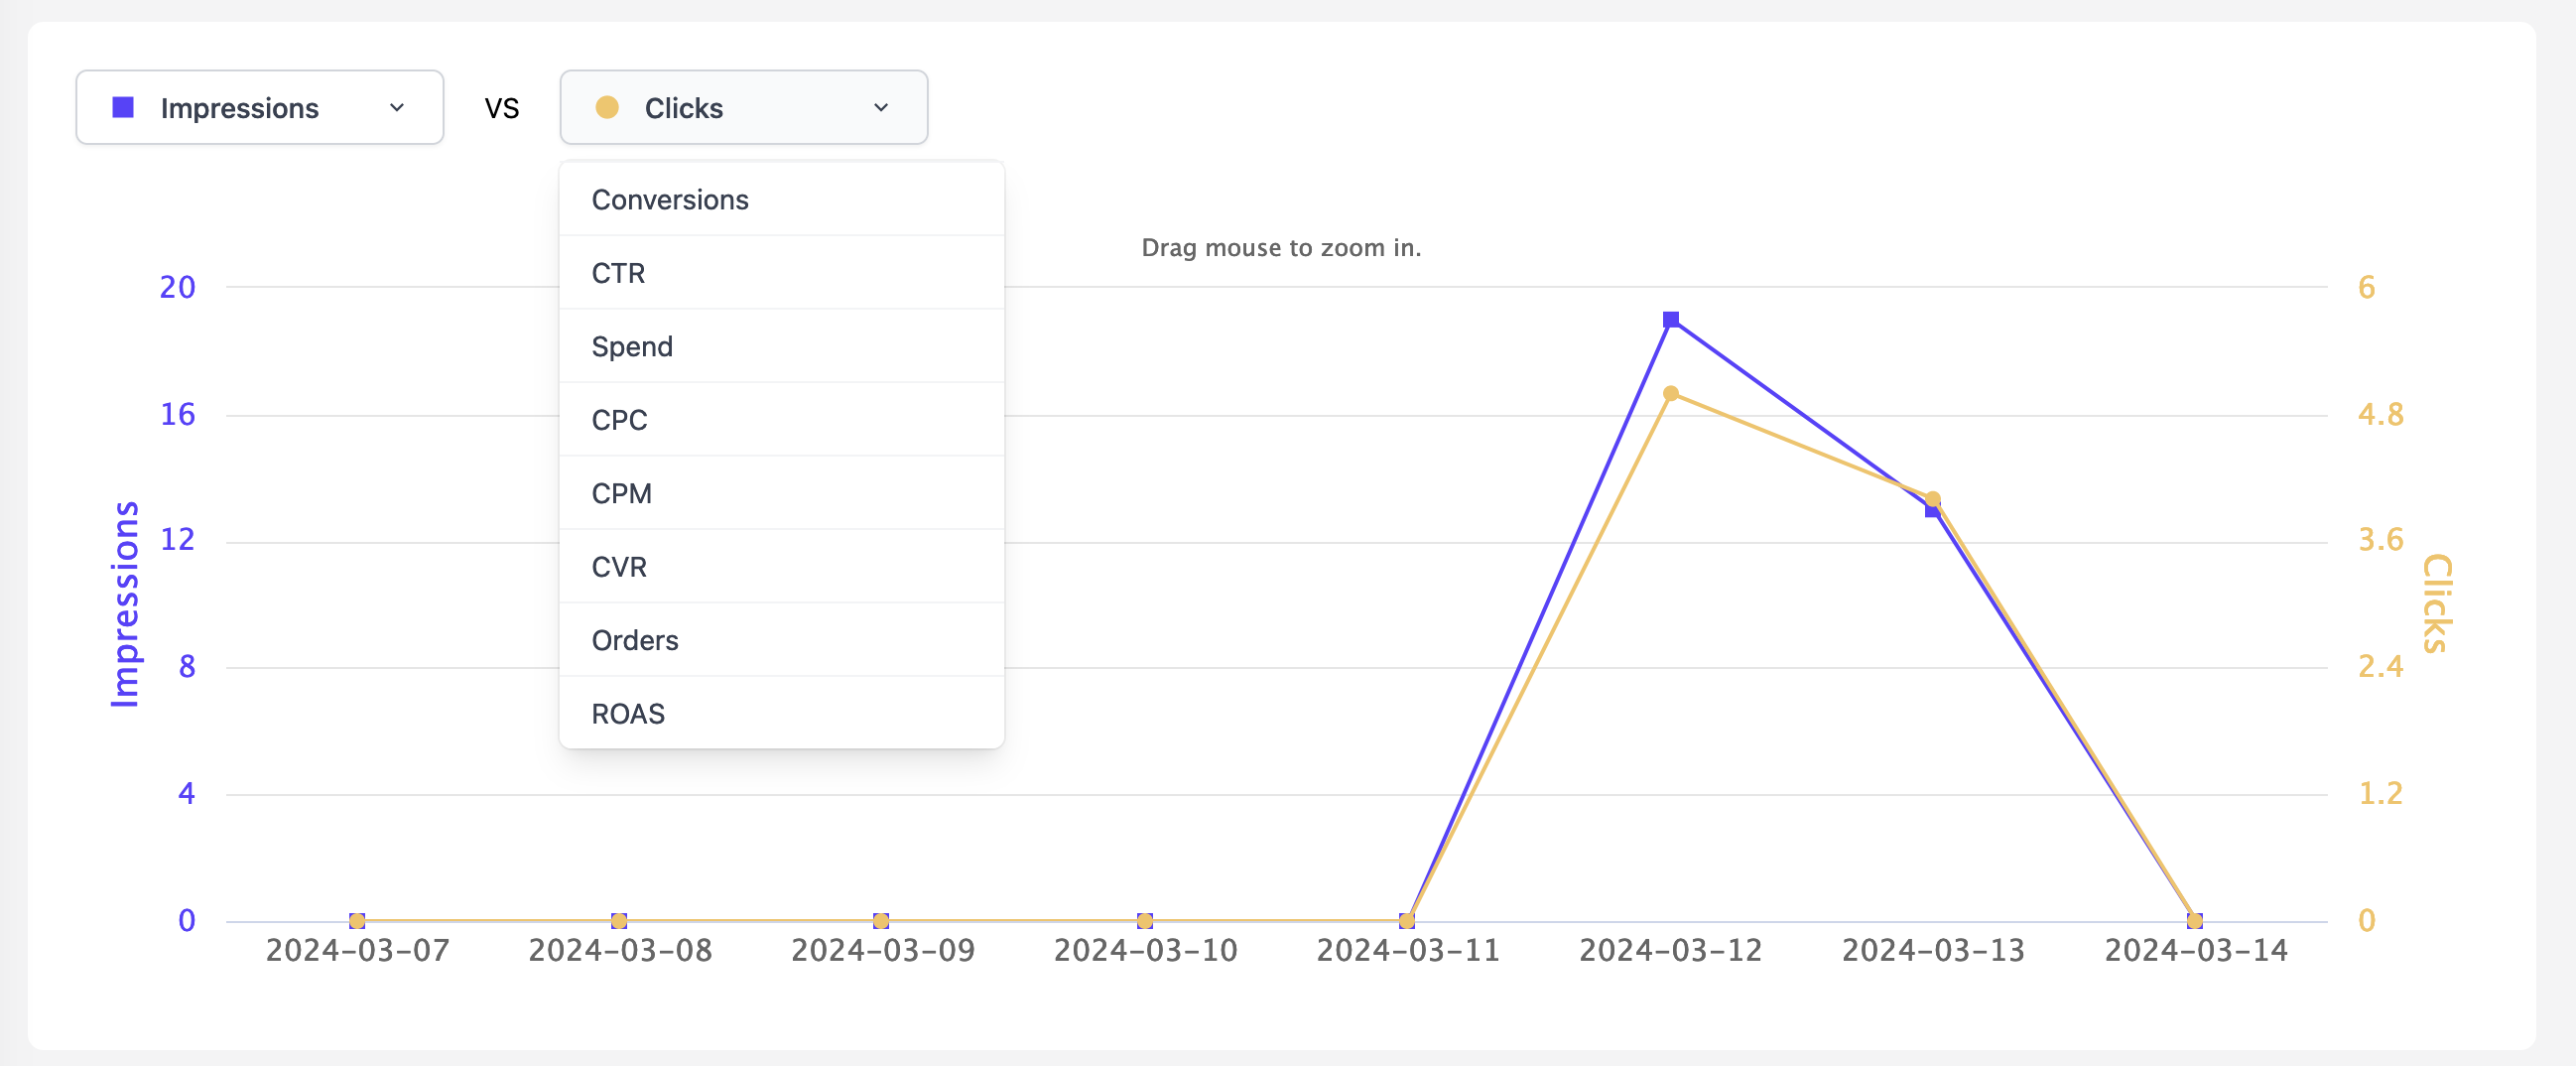
This graph enables you to compare two metrics against each other for the time period selected. The publisher selects what data is available in the two dropdown menus.
Campaigns table
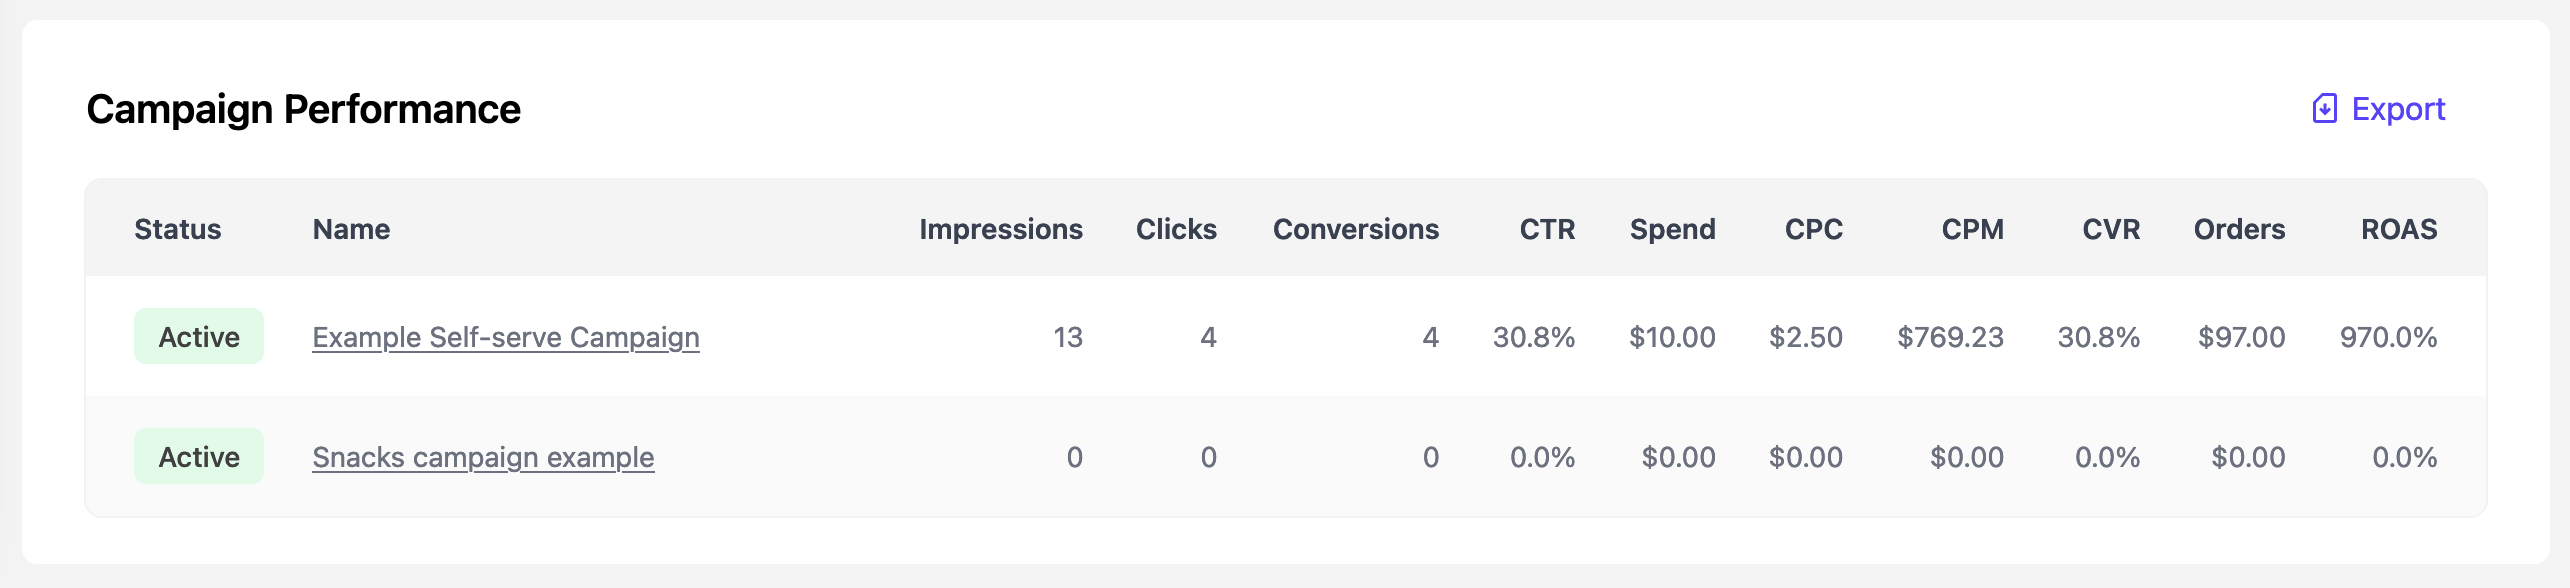
This table shows your campaigns at a quick glance, with performance data for the date range selected. Click on any campaign for additional details.
Campaigns only appear in this list if there is performance data for the selected time period.
Click Export to export this information as a CSV.
Click any campaign name to see more information about that campaign.
Updated about 1 month ago